Monitoring
Monitoring dashboard
If enabled in the server configuration,
a Grafana instance is directly accessible on /monitoring/.
The embedded dashboards provide informations about:
- Hardware monitoring (per-node CPU, RAM, disks, network traffic...).
- Container monitoring (per-container CPU, RAM, network traffic...).
- MongoDB monitoring (via
mongodb_exporter). - Redis monitoring (via
redis_exporter).
Logs monitoring with Loki
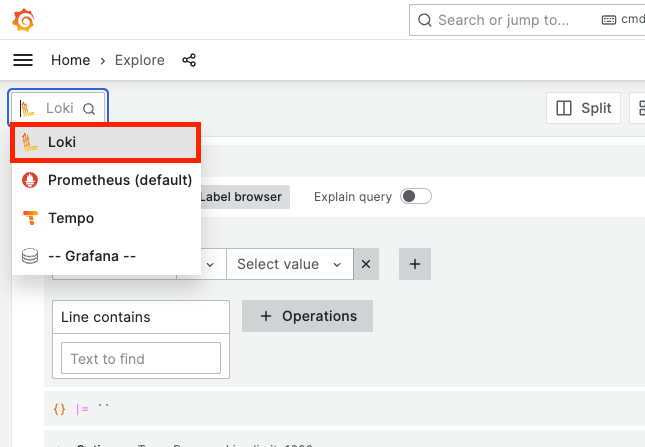
Grafana also provides a log monitoring tool called Loki. It allows you to search logs and visualize them in Grafana.
To access Loki, go to the Grafana dashboard and click on the "Explore" button in the left sidebar. You can then select the Loki data source and start searching logs.

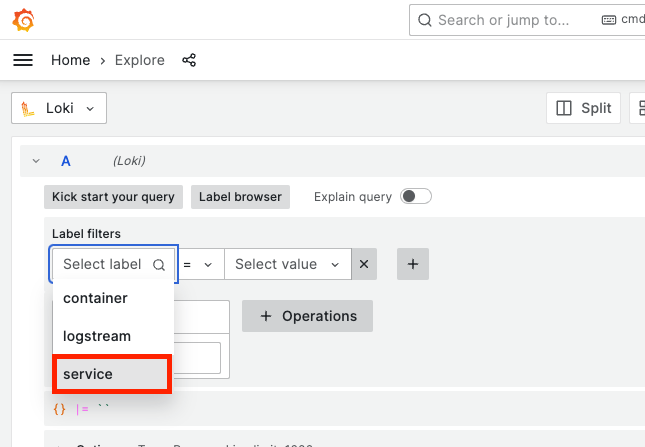
In the "Label filters" field, you can filter logs by service or container.

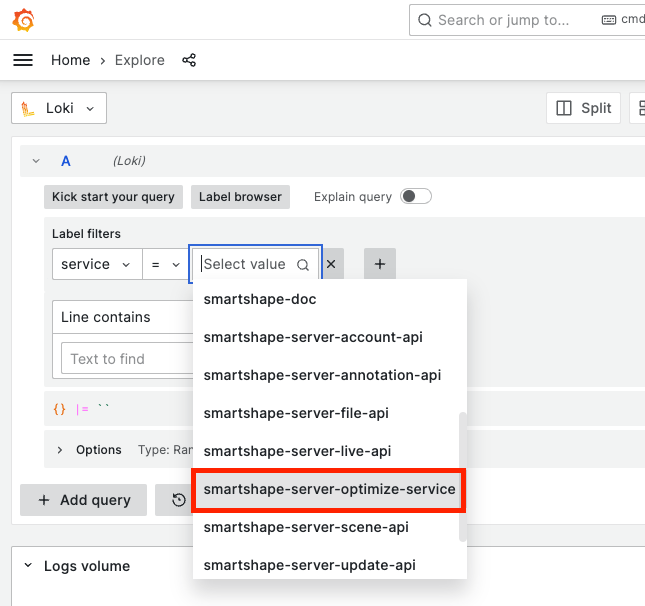
And choose the service or container you want to monitor.

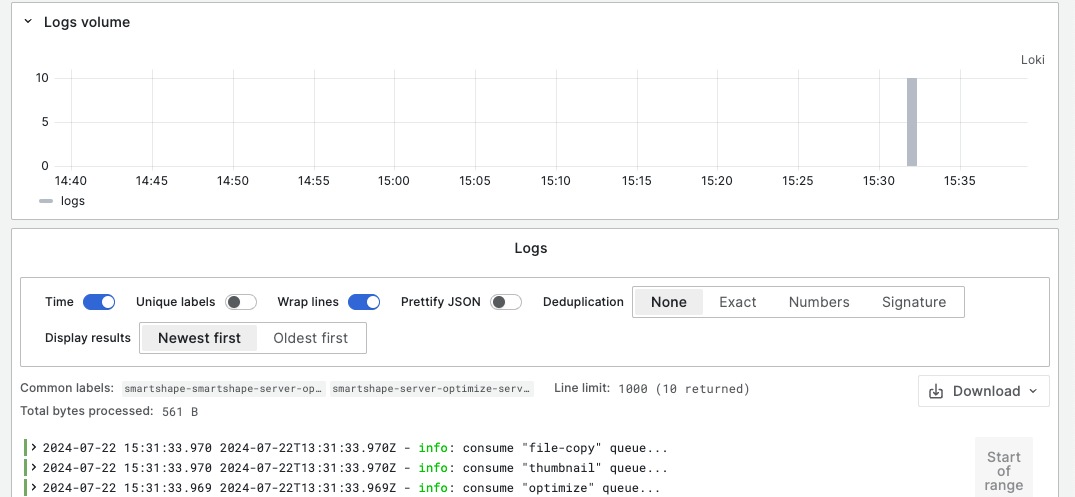
Then run the query to update the logs according to the filters. You can also start a live stream of the logs.
In the bottom of the page, you can see the logs. For more details consult the Loki documentation.

Custom monitoring
HTTP endpoints
| URL | HTTP Response Code | HTTP Response Body |
|---|---|---|
/file/ping |
200 | pong |
/scene/ping |
200 | pong |
/account/ping |
200 | pong |
/annotation/ping |
200 | pong |
/update/ping |
200 | pong |
/webhook/ping |
200 | pong |
Processes
| Name | Restarts automatically1 | Command2 |
|---|---|---|
| Live API | Yes | /usr/bin/node /opt/smartshape-server/roles/live-api/dist/index.js |
| File API | Yes | /usr/bin/node /opt/smartshape-server/roles/file-api/dist/index.js |
| Scene API | Yes | /usr/bin/node /opt/smartshape-server/roles/scene-api/dist/index.js |
| Annotation API | Yes | /usr/bin/node /opt/smartshape-server/roles/annotation-api/dist/index.js |
| Update API | Yes | /usr/bin/node /opt/smartshape-server/roles/update-api/dist/index.js |
| Account API | Yes | /usr/bin/node /opt/smartshape-server/roles/account-api/dist/index.js |
| Webhook API | Yes | /usr/bin/node /opt/smartshape-server/roles/webhook-api/dist/index.js |
| Webhook Service | Yes | /usr/bin/node /opt/smartshape-server/roles/webhook-service/dist/index.js |
| Optimize Service | Yes | /usr/bin/node /opt/smartshape-server/roles/optimize-service/dist/index.js |
| RabbitMQ | Yes | /bin/sh /opt/rabbitmq/sbin/rabbitmq-server |
| MongoDB | Yes | mongod |